Music My Way
a data-driven exploration of my personal Spotify habits

Introduction
Spotify has become known across the Internet for providing personalized data on users' listening history, from recommendations of new music to a yearly review of most-loved music. Given the robustness of the data Spotify collects, I decided to take a closer look to see if I could draw any further insights out of my own listening habits.
Methodology
Spotify's developer tools were used to download data to a JSON file; this data encompasses new songs added to my "Liked Songs" playlist, showing which new music I chose to save for future listening. The raw data can be downloaded here.
I then used OpenRefine in order to modify the dataset.
-
Basic Cleaning I started the cleaning process by limiting the data collected to a fixed period of time: June 1st through December 31st, 2019. This resulted in a dataset with 575 total records spread across 7 months. Columns were also renamed for ease of comprehension, and to remove extraneous symbols that were present in the original data. Finally, extraneous and irrelevant columns were removed.
-
Reshaping There were a few issues that needed to be addressed in the shaping of the data. Primarily, there were a number of rows of data corresponding to each song. This was due to the presence of multiple artists on certain songs, as well as multiple image files for the album artwork.
In order to combat this problem, I limited the number of artists per track to 3. Extra artists, present on 23 out of the 575 total songs, were dropped. I then transposed the columns for album artwork and artists into three distinct columns each. This left me with data that had one row for each song.
-
Enriching Amazon Music was used to categorize songs into genres, adding another dimension to the available data. I also created a column to note down whether songs were purely instrumental or had vocals and lyrics. Additionally, I was curious about how many times I downloaded an album in full, versus just downloading one or a few tracks from it. To gain insight into this, I compared the number of tracks I'd downloaded from the same album name to the total number of tracks in the album, available through the original dataset.
After these processes were completed, the clean data was exported as a CSV file (available for download here), and the steps logged by OpenRefine were exported as a JSON file (available for download here).
I then loaded the clean data into Tableau for visualization. I chose to use genre as a separator across all my visualizations, and assigned each category a color so that they could easily be identified on each graph. I also aimed to use as much of the data as I could; in addition to aggregated views of how many songs fit into certain categories, I created an explorable interface that allows the viewer to see data on individual songs.
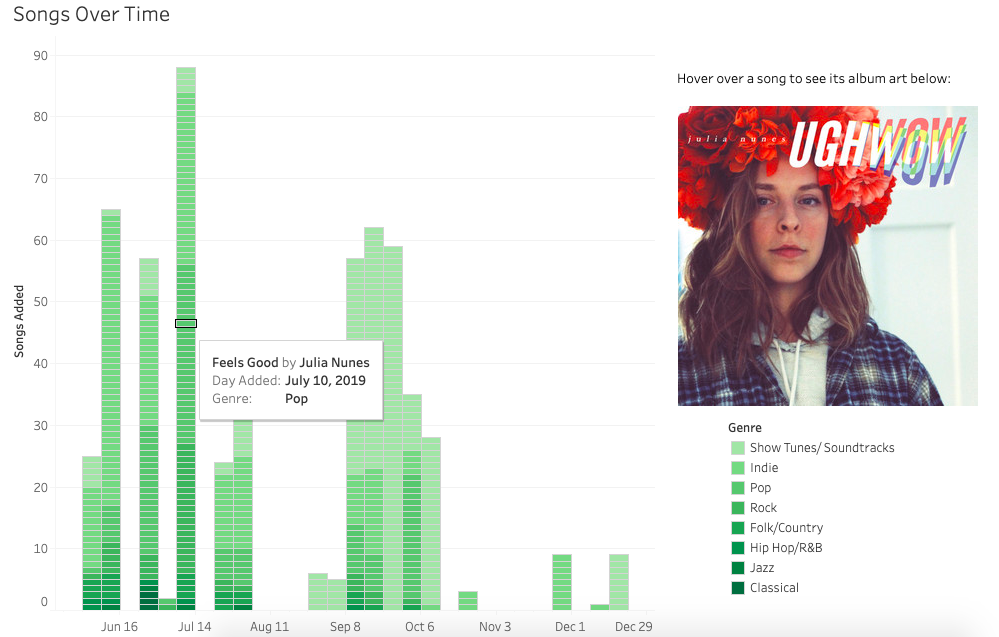
In order to create this view, the data was disaggregated and compiled into a stacked bar chart, with each distinct stripe corresponding to a single song. As the viewer explores the visualization, they are able to learn the song name, artist name, genre, the day I added it to my Spotify account, and most interestingly, an image of the album artwork. The last feature was added using a webpage widget in Tableau, using the URL for each album's artwork to generate the image.
Findings
Highlighted findings include:
-
Overall Features The majority of music that I downloaded during this period was not explicit, and contained lyrics or vocals, as opposed to being fully instrumental.

-
Genre Out of seven total genre categories, I downloaded the most songs from the "Show Tunes/Soundtracks" category and the fewest songs falling under the "Classical" genre. Interestingly, I was more likely to download a whole album for "Show Tunes/Soundtracks," while I was more likely to download a partial album in the "Indie" and "Pop" genres.

Conclusions
This project can be reproduced using other Spotify users' listening habits, and could also be used to aggregate data about multiple users. Future work on this project might involve assessing other time periods, or conducting a deeper analysis of typical song features in specific genres of music.
This project gave me useful experience in API usage, OpenRefine, and Tableau. Particularly, the customized areas of the visualization allowed me to experiment with integrating custom features into readymade designs.
The final deliverable for this project, in the form of a Tableau story, can be viewed below.
References
Amazon. "Amazon.com: Digital Music." Retrieved from https://www.amazon.com/MP3-Music-Download/b/?ie=UTF8&node=163856011&ref_=sv_dmusic_5.
Spotify for Developers. "Get a User's Saved Tracks." Retrieved from https://developer.spotify.com/documentation/web-api/reference/library/get-users-saved-tracks/.
Spotify for Developers. "Get Current User's Saved Tracks." Retrieved from https://developer.spotify.com/console/get-current-user-saved-tracks/.