Hi, I'm Shivani!

I'm a data analyst, visual designer, and web developer. I specialize in communicating complicated ideas in visually appealing, broadly accessible ways.

learn more below ↓

about me

I'm a professional data communicator based in Brooklyn, New York. I currently attend Pratt Institute, where I will earn an M.S. in Data Analytics and Visualization, along with an Advanced Certificate in User Experience, in May of 2021. I'm also currently a Digital Analytics Fellow at United Nations Global Pulse.

My goal is to bridge the divide between sciences and humanities. With a blend of skills in programming, analysis, communication, and design, I aim to contribute to a world where anyone can understand data, and where science and technology are comprehensible and accessible to all.

When I'm not working, you can find me exploring the city, experimenting in the kitchen, or entertaining a picky little parrot.

see my work ↓

my portfolio

Here are some recent examples of my work.

Queer in the Eyes of the Law

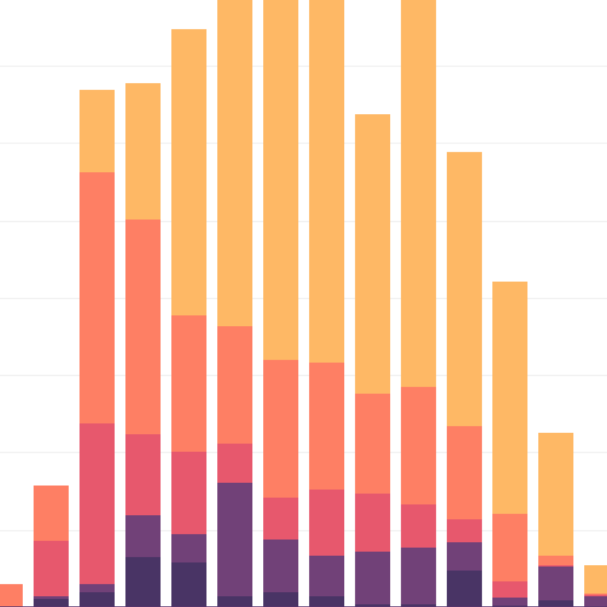
An end-to-end data analysis and visualization project that explores the laws governing queerness and how they differ around the world. This project is intended to interpret large, complicated data for an audience that may be unfamiliar with queer rights issues.

TOOLS USED: Google Sheets, HTML, CSS, JavaScript, D3

Digital Design for the Physical World

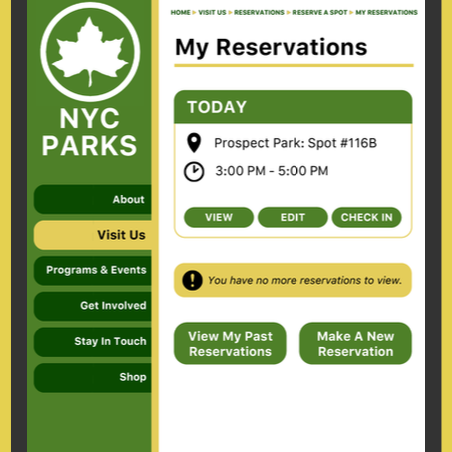
A user experience research project intended to bring a human-centered approach to redesigning the website of the NYC Parks & Recreation Department, as well as proposing a new feature for park visitors.

TOOLS USED: Figma, Optimal Workshop, Adobe InDesign

Beauty Dos and Don'ts

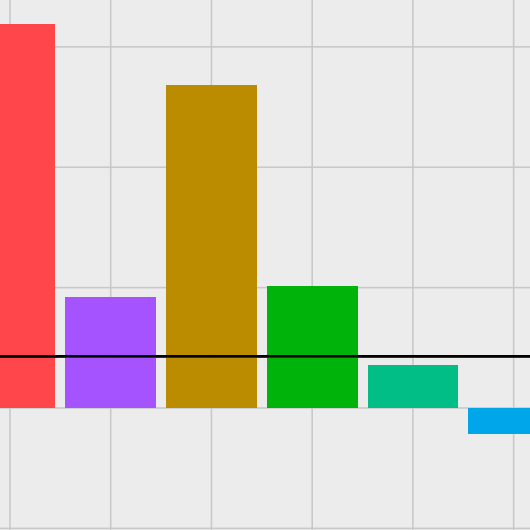
A comparative analysis of five cosmetic companies' Twitter habits, intended to highlight successful strategies for maintaining a social media presence in the beauty industry.

TOOLS USED: SuperMetrics, Google Sheets, Tableau, Adobe InDesign

The Speech of Star Wars

An exploratory data analysis project analyzing the scripts of the original Star Wars trilogy, including word frequency, sentiment analysis, and topic modeling. This project is intended to introduce and explain various common methods of text analysis.

TOOLS USED: R, RStudio

Music My Way

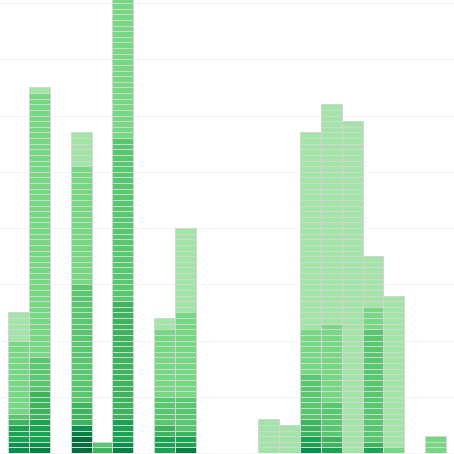
A data cleaning and visualization project exploring my personal music-downloading habits on Spotify. This project highlights tools used to gather, clean, and display data.

TOOLS USED: Spotify API, OpenRefine, Tableau

my experience

You can find a copy of my resume here.

skills


PROGRAMMING

HTML

CSS

JavaScript

SQL

Python

R


TOOLS

Tableau

Adobe InDesign

Adobe Photoshop

Microsoft Excel

Google Analytics

Google Data Studio

roles


UNITED NATIONS GLOBAL PULSE

Digital Analytics Fellow — October 2020 through May 2021

  • works with the communication, data, and design teams at UN Global Pulse
  • condenses complex research and scientific topics into comprehensible, accessible posts for the UN Global Pulse blog
  • creates data visualizations and infographics suitable for audiences including UN agencies, academia, private stakeholders, and the general public

KNOLOGY

Data Analysis Intern — October 2019 through March 2020

  • worked on an NSF-funded research project analyzing adult statistical literacy and the news media landscape
  • developed coding schema to analyze news stories based on linguistic structure and presence of mathematical and statistical concepts
  • wrote web-scraping programs to find news content pertaining to specific topics

THE WEEK

Editorial Assistant — March 2017 through August 2019

  • pitched and wrote scientific and technological news stories in a staff writing capacity
  • compiled news stories for weekly newsletters
  • created weekly original video content using Adobe Premiere Pro
  • assisted the multimedia team with finding and creating art for feature stories
  • edited, proofread, and formatted feature articles
  • coordinated with partner organizations to syndicate feature content
  • edited and published the weekly digital issue of the print magazine

Editorial Intern — August 2016 through January 2017

  • acted in a supportive capacity to the digital editorial team
  • cresearched stories and compiled licensed images to accompany news items
  • compiled analytical data about website performance

STREETEASY

Editorial and Marketing Contributor — July 2015 through August 2016

  • wrote real estate, news, and culture articles for StreetEasy’s blog
  • researched and compiled information on real estate trends and history in New York City
  • collaborated on marketing projects including SEO-focused external link generation

education


PRATT INSTITUTE

M.S. in Data Analytics & Visualization — expected May 2021

Advanced Certificate in User Experience — expected May 2021


NEW YORK UNIVERSITY

B.A. in Journalism — received May 2016

B.A. in Physics — received May 2016

contact me

Let's connect on Twitter or LinkedIn!